The presentation turned out very well, but just to attend the conference for one day, it was a lot of money, because you could not purchase a ticket to attend just one presentation. So, I’m sharing it with you here slide by slide, with all the bullet points that were presented:
SLIDE 1
• Welcome everyone.
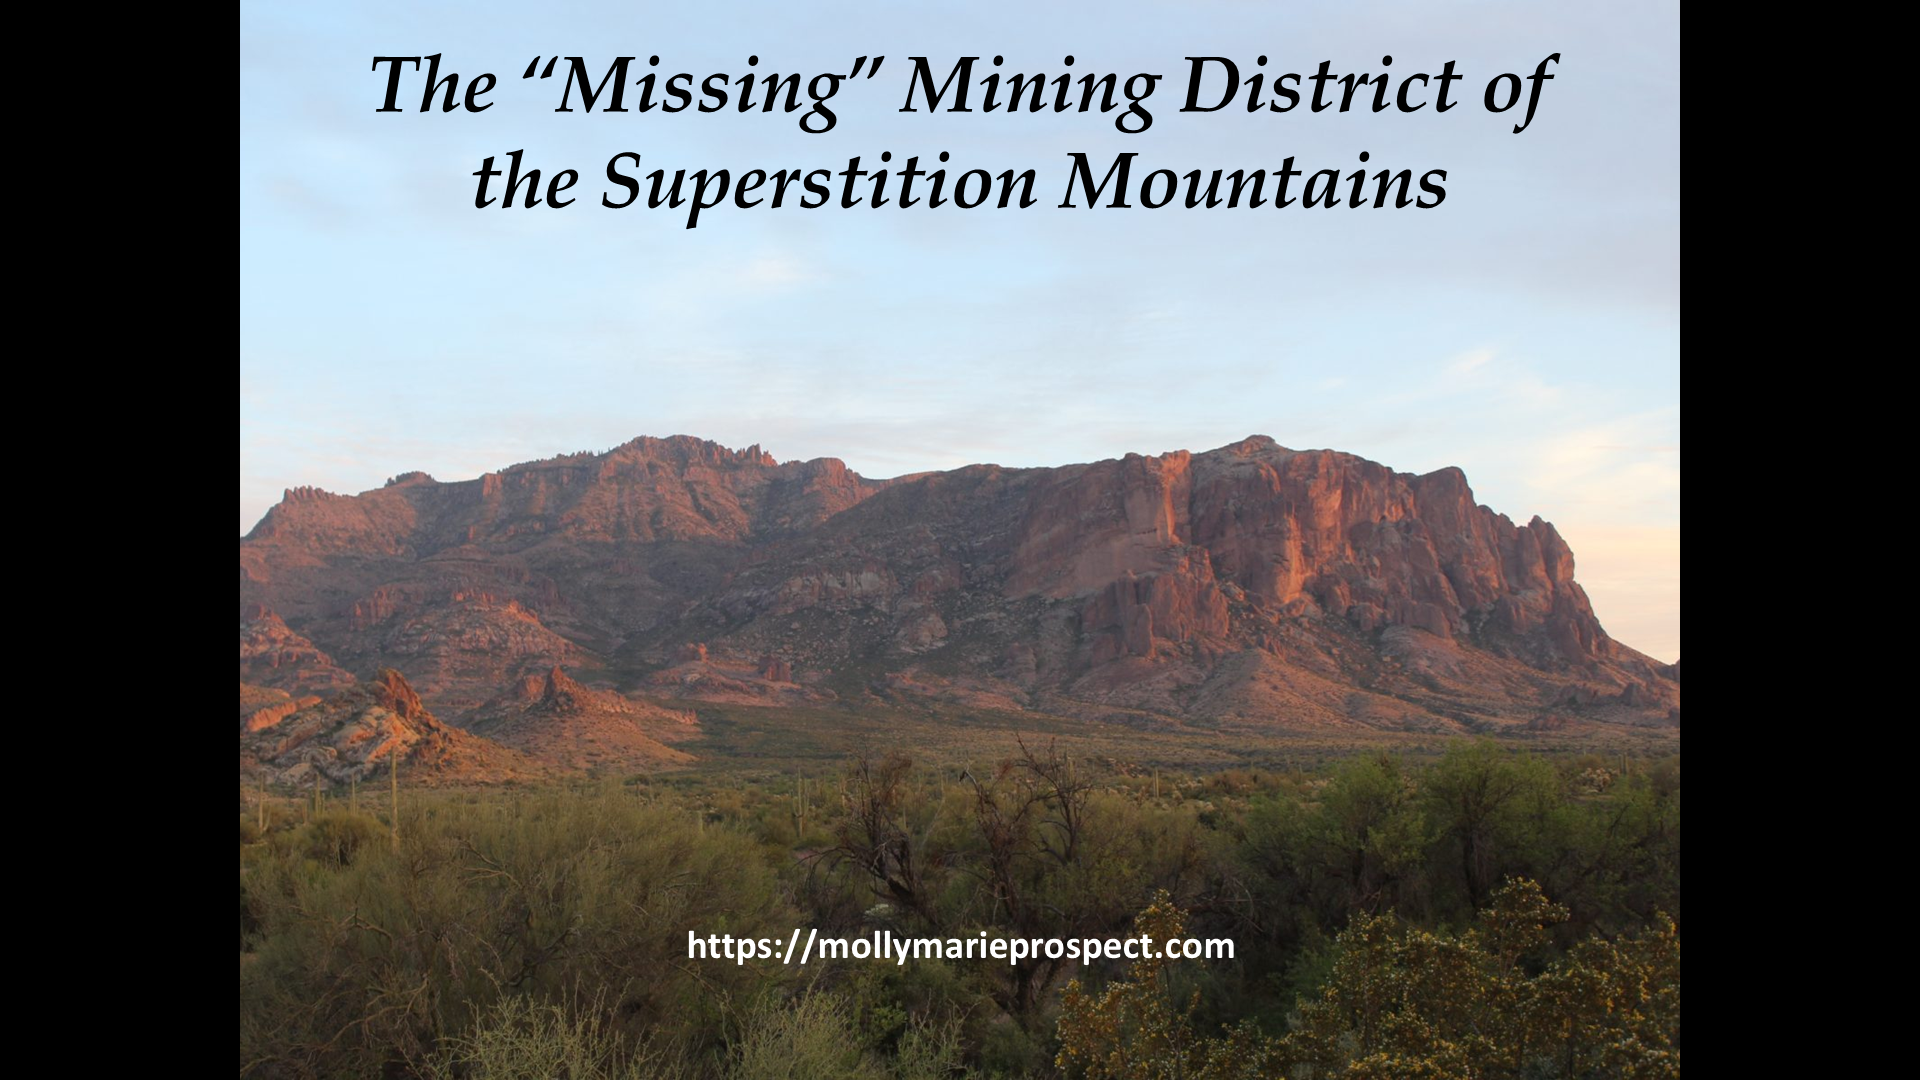
• My presentation is about a “Lost” mining district in the Superstition Mountains area about 35 miles east of here, and it is a culmination of 15 years of study and research.
• People have been looking for 130 years for lost mines or a “mine” in the Superstition Wilderness area, but the mines are not in the wilderness area.
• The oldest printed story that I’ve read about lost mines in the area was printed in the Phoenix newspaper in 1893, and it was about prospectors that had found a “Great Mine” just north of Superstition Mountain with many shafts, and what appears to be described as a large subsidence zone. The prospectors then wandered up to Goldfield to find something much greater the story said.
• The next oldest study that I’ve read was from 1895 by a writer named Bicknell in a San Francisco Paper. Bicknell interviewed dozens of people in this area from all ethnic backgrounds, and the consensus was that there was a mine with an 80-foot shaft, and that the mine was in a “District”. In 1895 there was only one kind of district, and that was a mining district; a place where there are many mines.
• Over time, the story devolved until it became a tale of one mine, and people forgot what the word “District” meant.
• The term “The Lost Dutchman”, did not even surface until 1952, when a book by the same name was published.
• This photo is of the north side of Superstition Mountain, and in the area in the photograph, 400 of a Peralta-led party were massacred by Apaches in 1848, at the end of the Mexican-American war. The party was hiding mines that had been mined by the Peralta family from northern Mexico since the early 1700’s. The Americans had just taken what is now the southwestern part of the U.S. from Mexico.
SLIDE 2

• Some may say, “How can an entire mining district be “Lost” outside the Superstition Wilderness area given todays’ technology?”
• This is a map of the Mineral Potential of the Superstition Wilderness and the surrounding area prepared in 1981 by the U.S. Bureau of Mines.
• 1981 was the beginning of the greatest down cycle in mining since the last depression, and this study was likely forgotten about.
• The red areas have high mineral potential and are outside of the wilderness area.
• The red area to the southeast is where the great Resolution deposit was discovered in 1992.
• The red area on the west end has had little or no exploration since 1981.
• The “G” in the red area marks the historic gold mining district of Goldfield.
• The “X” in the red area marks location of the Molly Marie Prospect
SLIDE 3
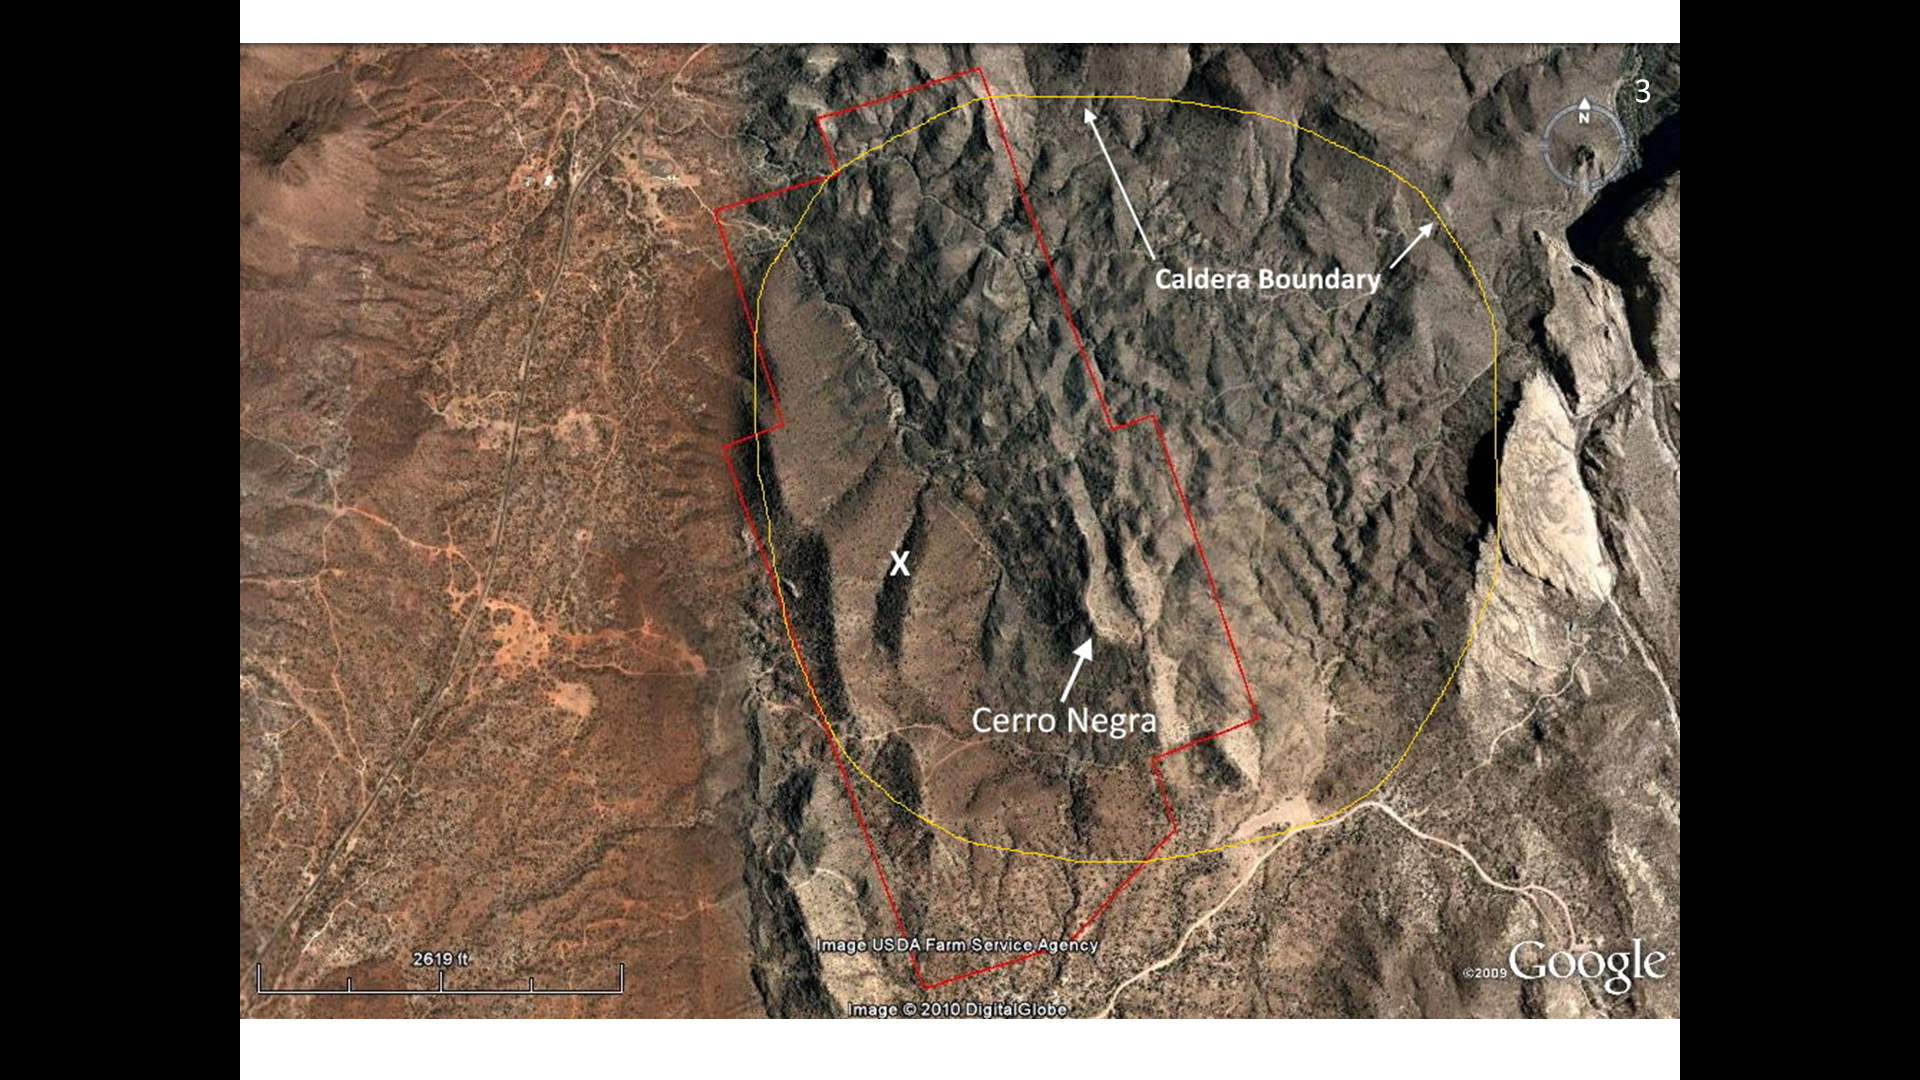
• The Molly Marie Prospect is a group of 20 contiguous mining claims sited on a collapse caldera over one mile in diameter.
• The red lines outline the group of claims
• A collapse caldera is created when the magma chamber of a volcano evacuates and the rock above it collapses.
• In this case, the volcano was then eroded to its base.
SLIDE 4

• This is a google earth photo of the Goldfield mining district located only 2-1/2 miles away from the Molly Marie Prospect.
• The Goldfield District is also sited on a collapse caldera and the volcano here was also eroded to its base.
• The brown areas on the margin are breccias. Breccia consists of fragments of rock that are created when the center of the caldera collapses, and the rock fragments are ejected around the margin of the caldera. Breccias are an excellent host for ore.
• Only a few mines that were in the Goldfield District are labeled here. They are all located in breccias.
• The Mammoth Mine was the largest. It was discovered in 1893 when a flash flood exposed mineralization in Weekes Wash. A shaft was sunk and the Mormon Stope was struck only 35 feet below the surface. The gold ore ran hundreds of ounces of gold to the ton. The stope was 20 feet wide and 200 feet long. The grade continued to the 400 foot level, and the mine reached the depth of 1022 feet below the surface. Even here, the grade was still .66 ounces of gold per ton.
• The Old Wasp claim labeled here had a major strike in 1983. A vein 8 feet wide was struck with a backhoe. The vein was heavy with galena, and a one foot wide portion of the vein ran 244 ounces of gold and 50 ounces of silver per ton. A million dollars worth of gold at 1983 prices was removed from a small open stope near the surface.
• These two mines are just examples of the bonanza gold found in Goldfield.
SLIDE 5

• Now, back the Molly Marie caldera, here is a highly enhanced google earth photo of it.
• The reddish areas are breccias that are found in multitudes greater abundance than those found in Goldfield. The red areas have highly magnetic soil as evidenced by the inset on the lower left. Just by kicking the soil and dropping a magnet on it produces instant results.
• Please note the spot marked with an “X” and the hill dubbed “Cerro Negra” . These will be talked about in detail.
SLIDE 6

• Many areas were found in the brecciated areas of the Molly Marie caldera that were suspected to have been mined by others by surface pits and filled back in.
• These disturbed areas were suspected to have been the same type of orebodies that were mined in Goldfield.
• A seismograph was rented two times from Geometrics. The refraction method was used on 12 areas in total. The data was screened by rented software, and the data from 8 areas was sent to a geophysicist for further analysis.
• This slide is a tomogram from the spot marked with an “X” in the previous slide, and was prepared by Zapata geophysical in Denver. This represents a pit 40 feet deep, 120 feet long, and the area is about 80 feet wide.
• All 8 areas that were screened and had the data sent to geophysicists indicated pits.
• Even though the outcrops of the orebodies have been removed, an alteration zone remains that surrounds the orebody.
• The inset in the upper right shows what the alteration looks like. The normally tan-colored arkose of the Whitetail formation has been altered to black chlorite, a type of mica. This type of alteration is commonly found surrounding the sub-seafloor portions of VMS deposits in Canada, but it was learned that it also surrounds the perimeter of a cousin of the VMS ore deposit, the IOCG (Iron Oxide Copper Gold deposit).
SLIDE 7
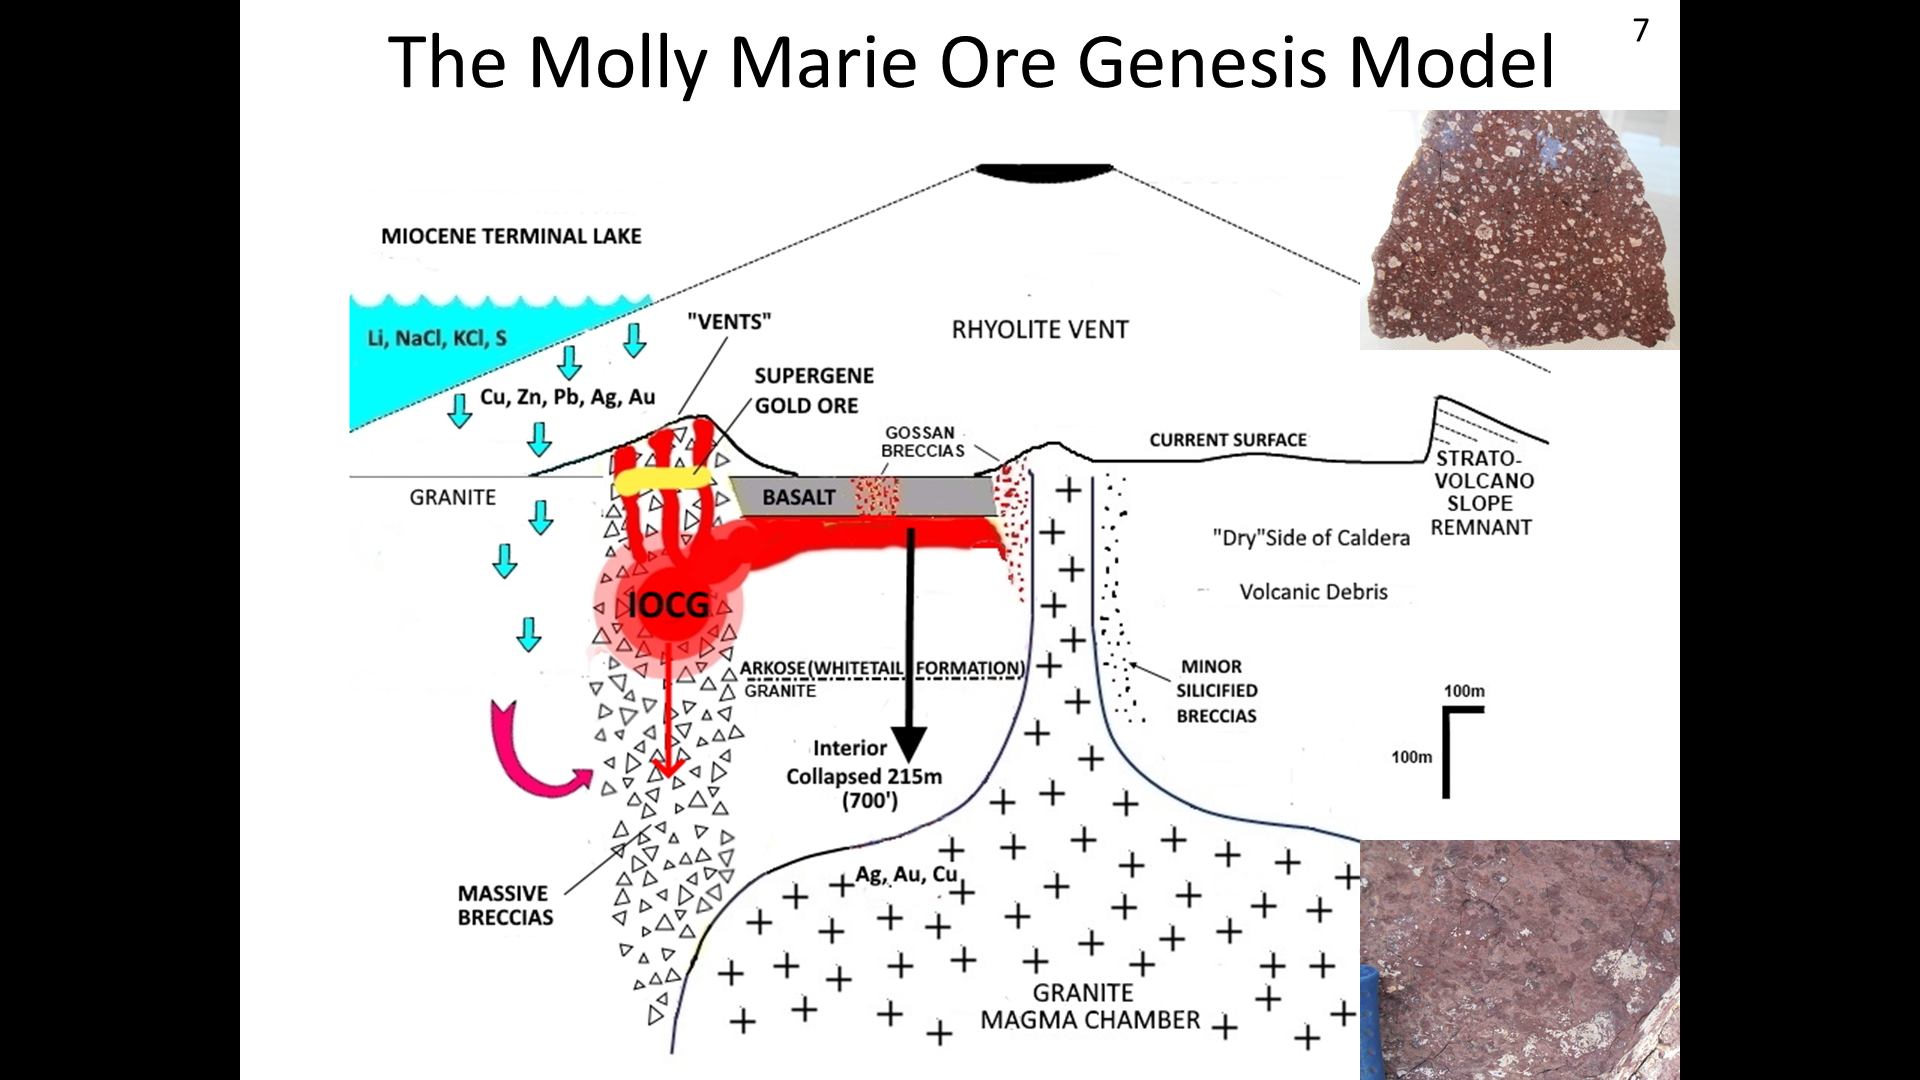
• This is the Molly Marie Prospect ore genesis model.
• 20 million years ago, southern Arizona was covered in deep brine lakes, because the Colorado River had not been formed yet.
• Concurrent and with the brine lakes and adjoining them was the Superstition volcanism.
• There are 3 main types of IOCG deposits, and this is the caldera type.
• The brine is highly corrosive and it dissolves the metals from the volcanic debris of the volcano. The solution percolates through the debris, surrounding rock, and the breccias and boils off near the magma chamber. The metals precipitate at the boiling zone in the breccias and beneath the layer of basalt in the caldera.
• The breccias are a great “trap” for metals because the rock fragments chemically react with the hot metal-laden brine. However, beneath the basalt exists even a greater trap. The basalt is an aquaclude stopping the upwelling hot brine, but the upper portion of the Whitetail formation contains a high amount of limestone. The limestone neutralizes acidic solutions which also cause the metals to precipitate.
• The inset on the upper right shows the rock that is found at the volcanic neck. It is a rhyolite porphyry that is very high in iron and can be highly magnetic. This porphyry is pre-enriched in metals by nature and is what the volcanic debris was comprised of.
• The inset on the lower right is the massive hematite porphyry found in large outcrops at “Cerro Negra”
• Supergene gold is also in the model. Supergene gold is created when the brine lakes subside and residual salt dissolves the gold in the ore and it is precipitated at the water table. This process creates incredibly rich gold deposits, and this is what the pits were focused on.
SLIDE 8

• After the seismic testing was done, it was concluded that beyond a reasonable doubt many filled-in pits were located in the breccias.
• If all this ore was mined, it had to be processed somewhere nearby.
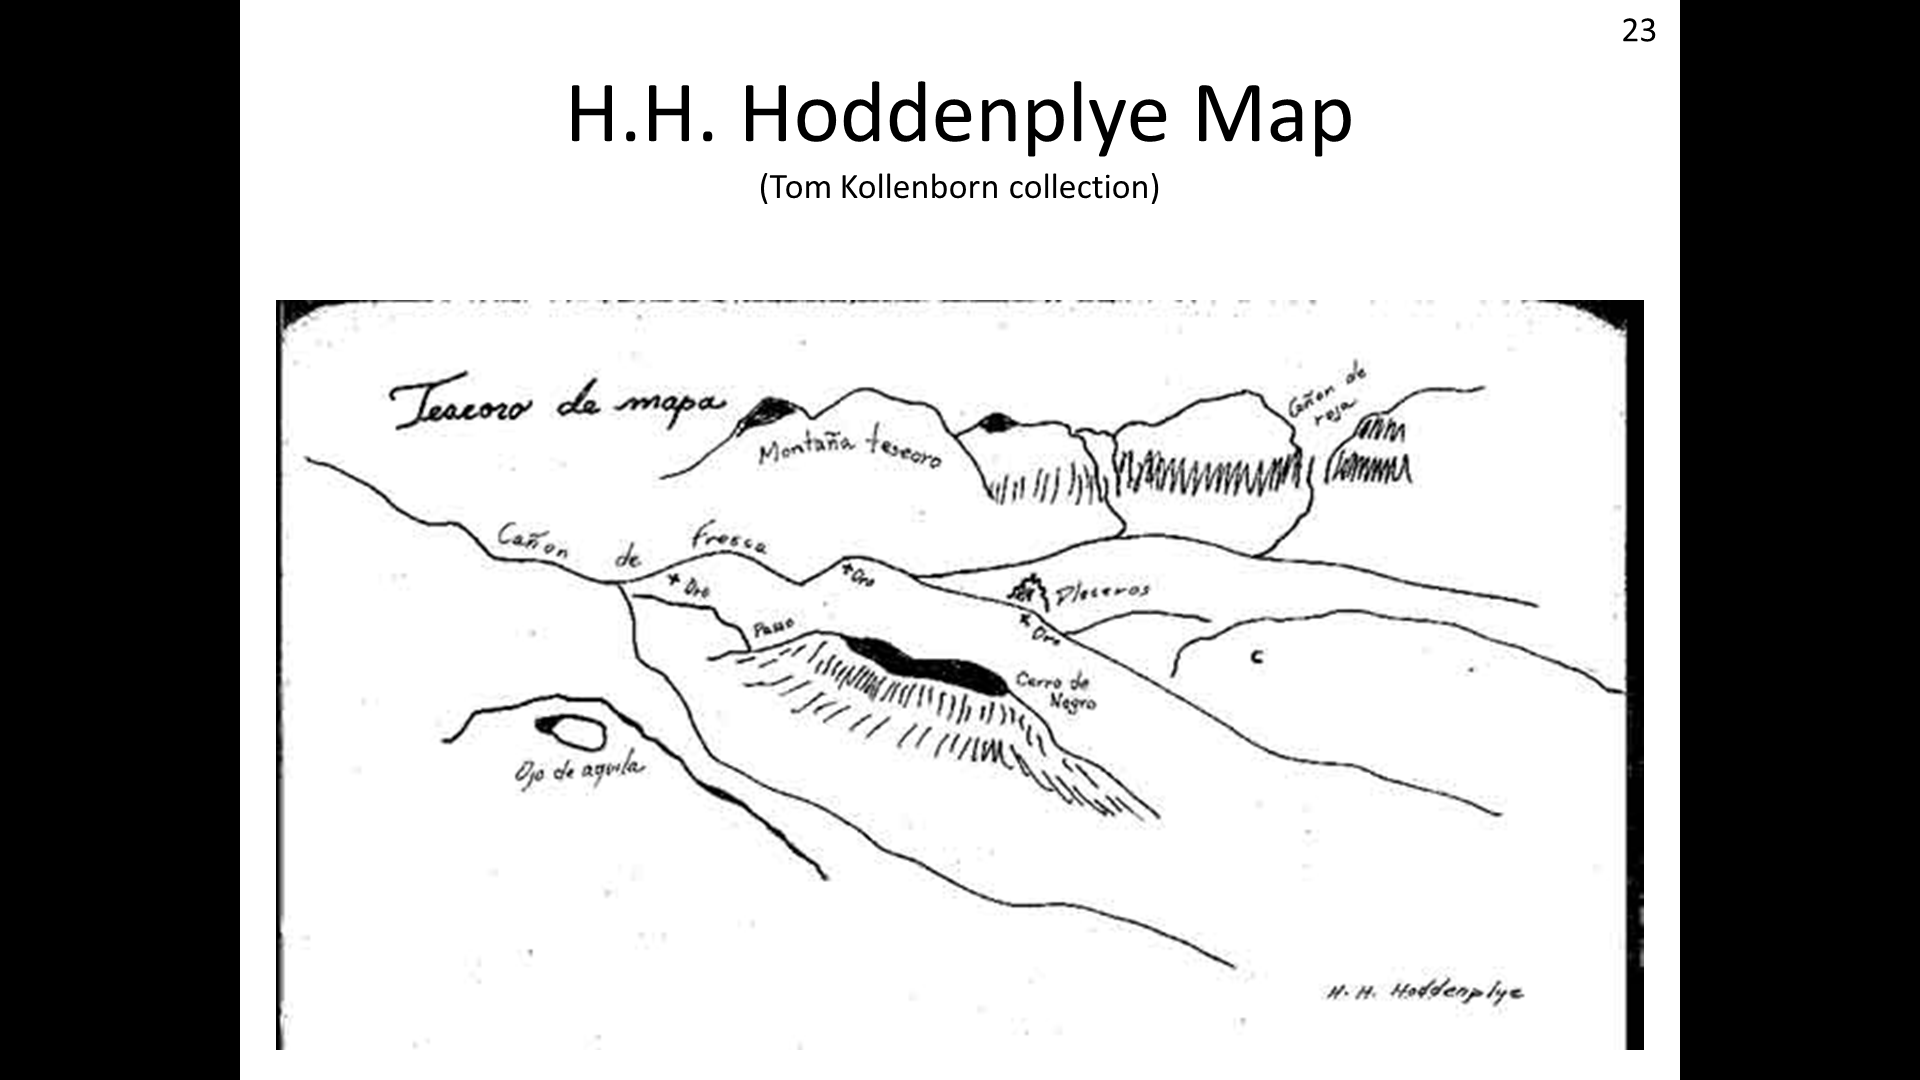
• Of all the old maps “out there” only one showed a processing area, and this was the “Minas del Oro” map, or “Gold Mines” map in this slide.
• This was found to be the most comprehensive map in existence. It is made of leather and the third digit is worn off, so it could be from 1814, 1824, 1834, or 1844. Many experts have concluded that this map is authentic.
• The river labeled Rio Salado was believed to be incorrectly name, because the Salt River runs east-west, and most maps have north at the top. It was believed this had to be First Water creek that flows in First Water Canyon most of the year except for droughts.
• Please note that “Negra” is the center piece of the map and appears to be a fold in the basalt.
• Please note certain features on this map, as it will be shown on a google earth photo where their locations are. Notably, the locations of the Negra, Picacho, Campo Mayor, Arrastras, Camino, Placeras del Oro, and Minas will be shown.
SLIDE 9

• This slide is a google earth photo of the area represented by the Minas del Oro map.
• The spot that is “Negra” is the hill dubbed “Cerro Negra”. This is the only fold found in the basalt for miles around.
• The “Campo Mayor” corresponds with a place called Hackberry Spring. This spring flows year-around, and it is located at the foot of a 500-foot tall cliff. This cliff is orientated in a direction so the sun never hits the bottom as can be seen by the shadow in the photo. This is quite a literal oasis, and is the perfect location for the main camp.
• The place where the arrow points from the label “First Water Creek” was suspected to be where the arrastras (crushers) where located.
• The spot labeled “cart ruts” will be shown in detail, and are located on the large “Camino”(road) on the map.
• The “Placeras del Oro” (gold placers) were suspected to be in First Water Canyon, and will be shown in detail.
• The “Minas” on the map were suspected to be the pits that were proven seismically.
SLIDE 10
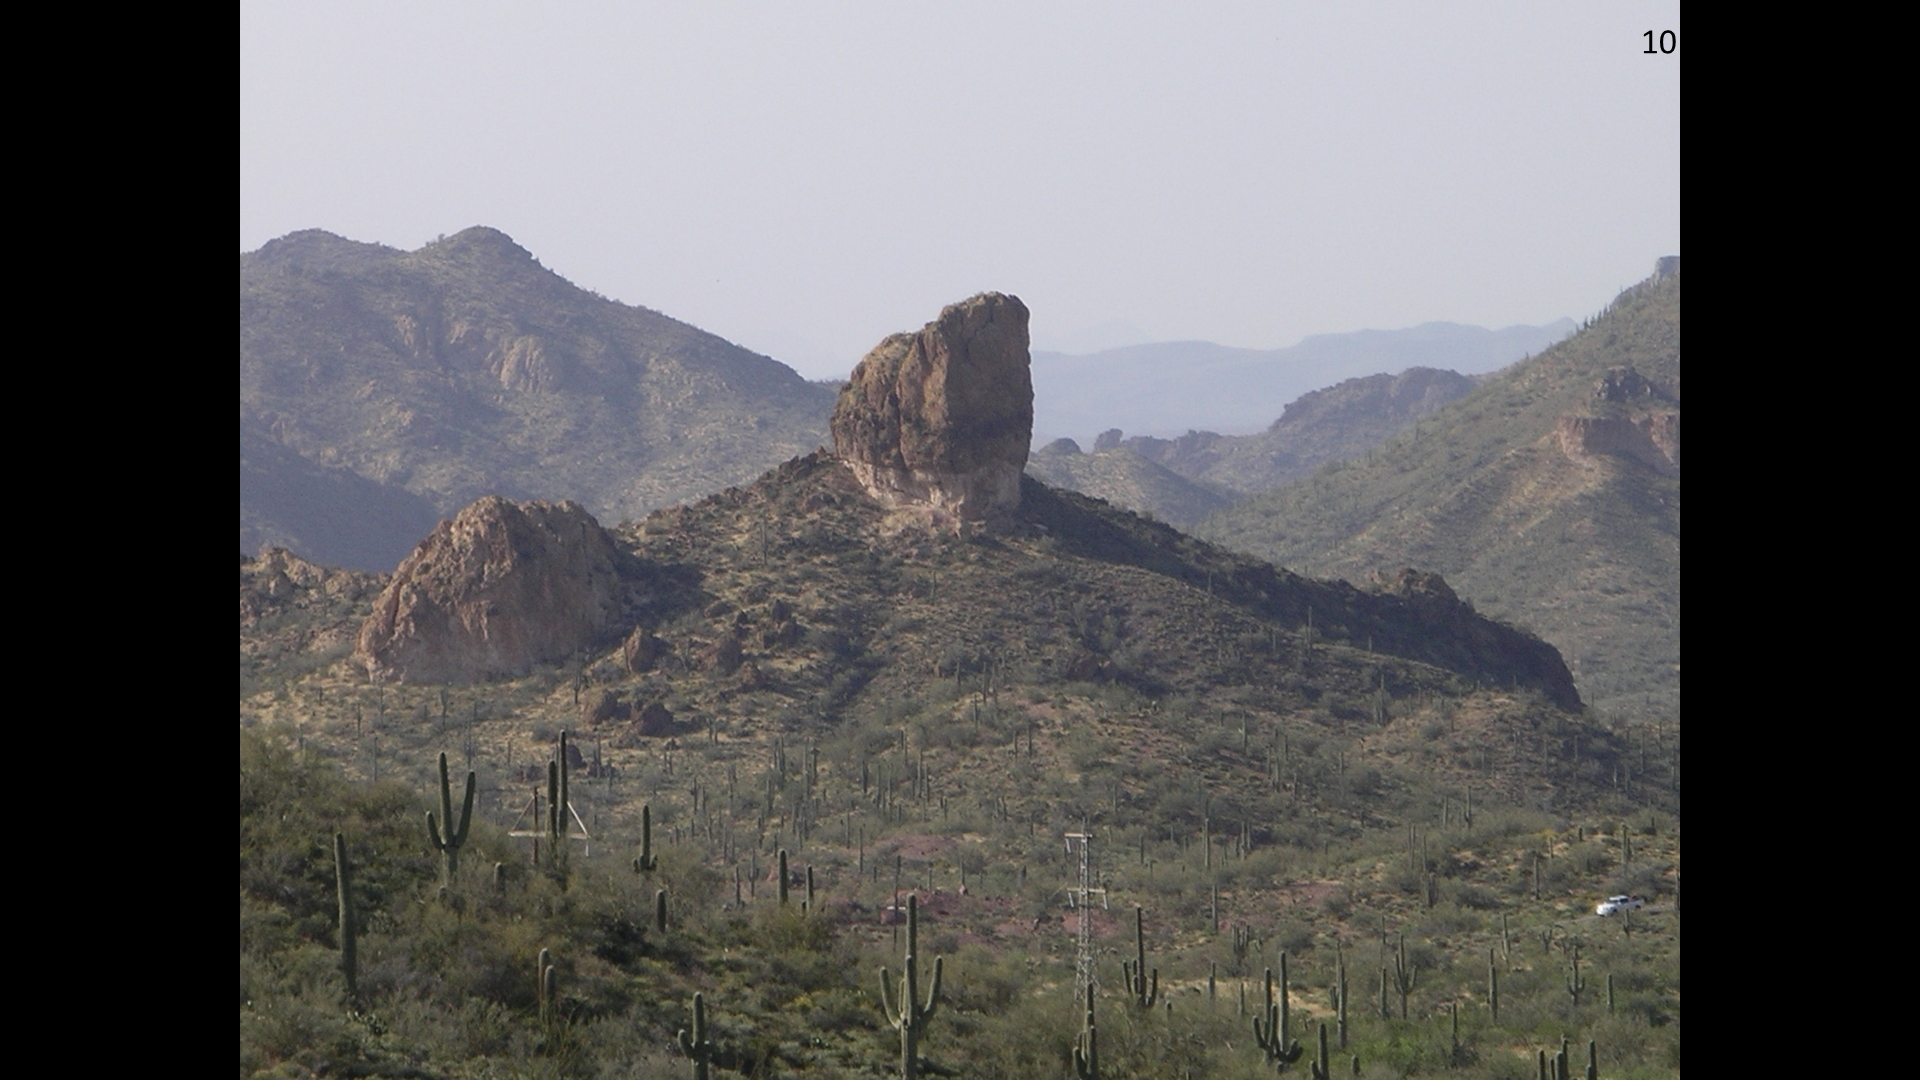
• This is the “Picacho” shown on the map, and is just northeast of the “Minas” shown on the Minas del Oro map. Some call this Gonzales rock.
SLIDE 11

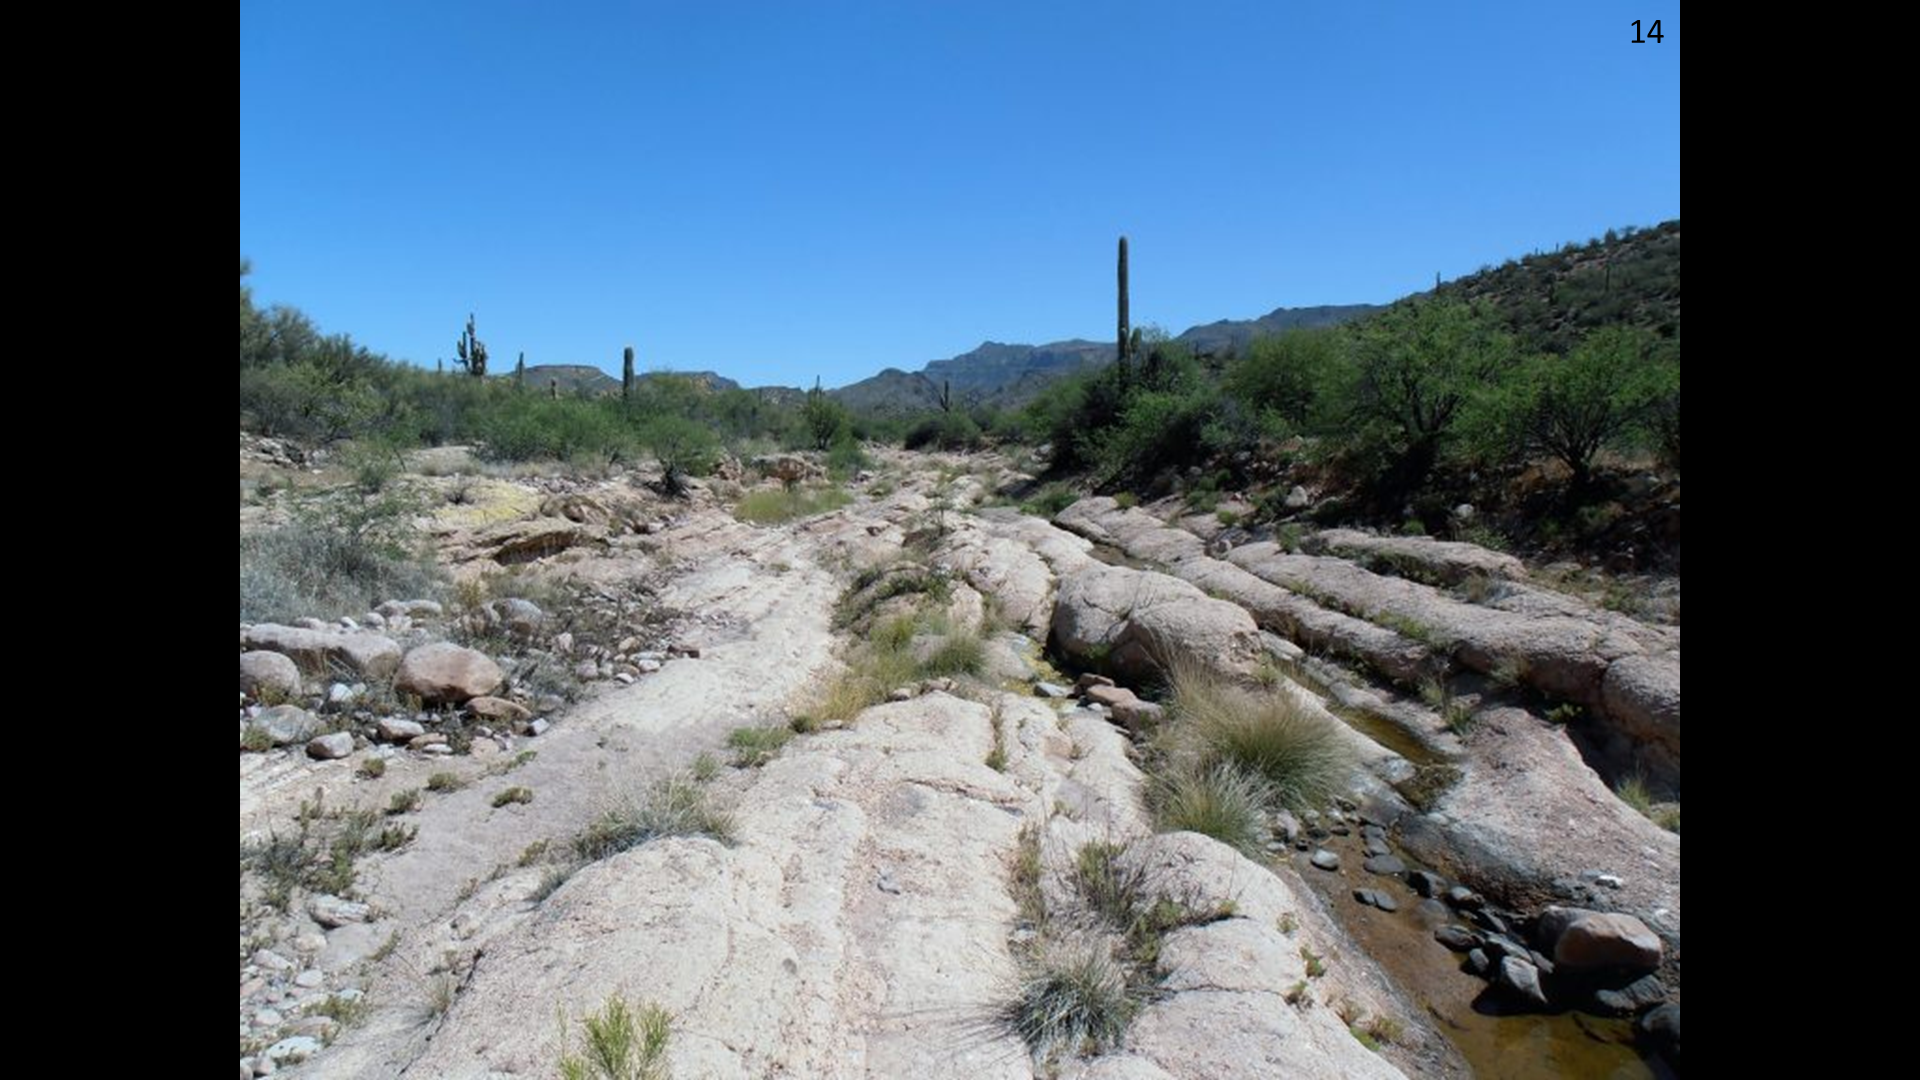
• This is “Cerro Negra”, the hill that is the great fold in the basalt. This is looking east.
SLIDE 12

• After taking several hikes into First Water Canyon to prove my suspicions, ruts were noticed in the road that were suspected to be cart ruts (the photo labeled “before”).
• A broom, camera, and tall stepladder were brought out to clean the ruts and photograph them from above, and the photo labeled “after” was gained.
• Note the circled area where there are flat grooves created where the wheels rolled over a small ledge. It can be seen that these were created by steel rims. The other grooves were filled with gravel after rains and the wheels made rounded grooves.
• The hill and road behind the camera in the “before” photograph is very steep (>25%) and could not be negotiated with carts. The carts had to “zig-zag” down the hill. This is zig-zag is even shown on the Minas del Oro map.
• The road shown was made in the 1970’s by a small dozer making a road to the satellite First Water Map. The dozer apparently disturbed the topsoil, and monsoons did the rest. The Peralta’s must not have known that they existed, or they would have removed them.
SLIDE 13

• The cart ruts were evidence of countless loads of ore being hauled down to First Water Creek for processing.
• The ore absolutely had to be processed using amalgamation and mercury or approximately 50% pf the gold would have been lost.
• A mercury vapor detector was rented to test the air and soil in the area.
• A research paper was found about testing the soil in Potosi, Bolivia for mercury. Potosi is likely the most mercury-polluted place in the world due to the use of the patio process for recovering silver.
• In Potosi, small holes was dug, and the “sniffer” of the mercury vapor detector was immediately put in the hole, and the soil briefly expelled mercury vapor.
• The same method was used on a large flat area near the creek by the satellite First Water Ranch, and an extremely high amount of mercury vapor was detected. As can be seen in the slide, the vapor started at .87 ug/m3, peaked at 2.75 ug/m3, and returned to 0, all in 13 seconds. These readings were almost identical to that found at Potosi, and this same level of mercury vapor was found in several holes.